
|
Edward Lowton
Editor |


|
| Home> | Plant, Process & Control | >Compressors and ancillary equipment | >How digital compressed air monitoring cuts costs by 30% |
How digital compressed air monitoring cuts costs by 30%
28 March 2024
Production teams are using digital services to identify and locate up to 30% electricity savings by locating and calculating the costs of wasted compressed air, explains Charlie Walker

HAVE YOU ever walked into a production hall early in the morning, before the machines start up, and heard a hissing sound? That is the sound of compressed air leaks. It may be commonplace enough, but it is still the sound of your company’s cash quite literally disappearing into thin air.
Manufacturers are facing unprecedented challenges to stem soaring energy costs, while responsibly reducing their carbon emissions. As the so-called “fourth utility” of manufacturing, compressed air systems are one of the most expensive resources in production and logistics. With anything up to a third of compressed air being wasted in a typical operation, the cost-savings available can be a big number.
"Hit and Miss"
Yet, this apparently low hanging fruit is simply often overlooked. Tracking down and fixing leaks can be a hit and miss affair; for some, only a matter of "listen, look and detect". When the pressure drops, it’s tempting to turn up the power - increasing the load on the compressor, and probably push more waste out from the weakest points.
Fluctuations in pressure compromise production efficiency. There will be more unplanned maintenance interventions, more unexpected machine downtime, and the compressor's service life will be shorter. Product quality and reject rates could suffer if air is not delivered at a constant, optimum pressure.
Regular maintenance inspections are costly and labour intensive. Even with a modern energy management system, a maintenance team may only survey the plant every three or six months. External companies may be called in to conduct periodic spot check audits. The data provided is reliable only for one moment in time.
Even if you walk around the factory today and fix all your leaks, tomorrow there might be three more you will not have found. There is also little that can be gleaned from one-off checks about any trends or patterns. Do some machines use more compressed air than others, when, and why? How can compressed air energy reduction best be targeted across entire processes and production halls?
Digital services
Increasingly, smart sensors are being combined with application-specific software and digital services to deliver real-time condition monitoring and predictive maintenance. The data can be aggregated and evaluated by intelligent algorithms and the results displayed to users in an easily visualised format. As a result, trends can be spotted, and insights can be gleaned that could not have been identified previously.
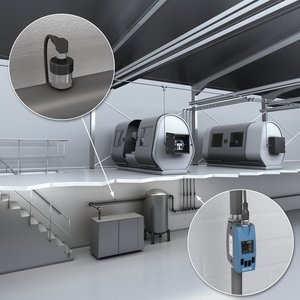
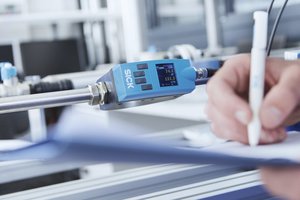
The data output from smart and accurate flow sensors that measure compressed air is the ideal candidate for this simple, but transformative, technology. The SICK FTMg is a multifunctional flow sensor that enables the measurement of live values for compressed air energy in kWh. Data from the FTMg flow meter is presented via the SICK FTMg Monitoring App, which has been developed from SICK’s proven Industry 4.0 Monitoring Box condition monitoring platform. As well as values for pressure, temperature, flow velocity, mass flow rate and volumetric flow rate in real time, the sensor provides totals for energy use, volume and mass over a pre-defined period.
The user-friendly dashboard makes it easy to interpret data to detect leaks or overconsumption and to look for changes and trends. Email alerts can be set up for maintenance reminders or to give pre-defined warnings with job recommendations, for example when data strays beyond pre-defined limits. Users can drill down to identify costs, for example for individual production centres or by shift.
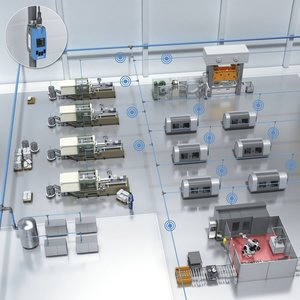
Up to eight FTMg flow meters can be configured via each SICK Smart Services Gateway, which collects data, aggregates and encrypts it before sending it securely via the customer’s own IT infrastructure through a firewall to the SICK cloud. Alternatively, it is possible to by-pass the IT infrastructure by using mobile communications over 4G. Individuals then have access through a personal SICK ID from any device with a web browser.
Energy cost calculation
Now, SICK has further developed the system to deliver a pioneering solution that can accurately predict the significant cost savings that can be made by fixing air leaks and removing wastage across entire production and logistics facilities. SICK’s Monitoring Box FTMg Premium is a digital and scalable service that can help make compressed air cost savings of up to 30%, as well as to eliminate costly manual maintenance regimes.
The application of specially-developed algorithms allows data from strategically-positioned SICK FTMg flow meters to be converted into a meaningful cost-calculation of how much energy can be saved. Furthermore, it can show users exactly where to look to target the greatest efficiencies.
Production planners, energy managers and maintenance engineers can follow easy-to-use dashboards and make decisions about compressed air cost savings using a scalable system that is simple to 'bolt on' to the production process with minimal set-up and no programming.
We are already seeing how early adopters of SICK’s FTMg Monitoring Box Premium digital service are gaining unexpected insights. Armed with the additional data, users have, for example, been able to make start-up and shutdown management of processes and machines more efficient, improve compressor control, and manage peak loads.
By interpreting the data, leaks and inefficiencies are easily eliminated, users understand their processes better and can make around-the-clock decisions to optimise their energy consumption. They can make their production processes more sustainable, for example by reducing their CO2 consumption. The data insights also contribute towards ISO50001 Energy Management certification.
Data monitoring insights
By tracking consumption over time, losses are easier to spot and correct. For example, energy waste is clear if the compressed air usage graph does not baseline close to zero at weekends. Is there a surge in power usage on a Monday morning when machines are turned on? Then, perhaps, a more efficient power-up sequence could be adopted to prevent overloading the compressor.
Our customers have been able to set up specific alarms to warn of leaks or inefficient machine consumption. By comparing compressed air data from each measuring point, machine, and production line, cost drivers or over-consumption have been identified, for example, by comparing a machine type with the same function on two production lines. Compressed air efficiency comparisons can similarly be made across plants.
Major annual savings
One successful adopter is a major European beverage manufacturer. Their production and filling lines consume one million cubic meters of energy-intensive compressed air every year. To reduce consumption and cut costs, about 50 FTMG flow sensors are positioned across several production lines. The sensor data is analysed with intelligent algorithms to evaluate how compressed air is being consumed during normal operations, as well as during downtimes. Armed with this information, the system can begin to pinpoint the source of potential leaks. An annual saving of almost €60,000 was possible within a just a few days of the system going live. Further savings are uncovered on a regular basis as new leaks occur.
Continuous monitoring of individual machines, and of the production site as a whole, gives a clear overview of compressed air energy costs that draws on statistics, trends and KPIs. Equipped with advanced evaluation powered by analytics, the right tools are in place for efficient maintenance planning, measurable cost savings, and data-based profitability calculations.
Charlie Walker is digital services consultant for SICK UK
For more information:
Tel: 01727 831121
- Productivity enhanced
- Innovation in action
- Led gets straight to the point
- Light grid becomes 'light chain'
- Tamper-proof safety transponder
- Contour-based localisation system
- Sourcing solutions
- Safety relay
- Simple and speedy proximity sensing
- SICK W10 swipe-and-set-up touchscreen sensor is a world first
- MAT - Modular Air Trolley
- Belt drive compressors
- Monitors compressors
- Plugging the skills gap
- Compressor range
- Modular dryer design
- Accurate diagnosis
- Plant complies with latest medical standards
- Hertz Kompressoren UK launches HSC D direct drive air compressor range
- Filter elements tested to ensure air quality


